The primary step of the solution process by powder diffraction data is the indexing process. Its main goal is to recover the unit cell parameters (a, b, c, α, β, γ), by assigning the appropriate triple of Miller indices (hkl or h) to each observed interplanar spacing (dh). Indeed, the indexing step enables to reconstruct the three-dimensional elementary cell by the information on the dh values extracted from the experimental one-dimensional pattern. A wrong unit cell is responsable for the failure of the structure solution process, consequently finding the correct unit cell is a mandatory request.
The indexing process is performed by EXPO2014 via the program N-TREOR09 (Altomare et al., 2009), the evolution of the N-TREOR software (Altomare et al., 2000). In addition, EXPO2014 can determine the unit cell by two widely used and freely available indexing programs: DICVOL06 (Boultif & Louër, 2004), McMaille (Le Bail, 2004).
EXPO2014 can index a powder diffraction pattern by one of the three following ways:
1) by graphic interface, by creating a new EXPO2014 input file or loading an existing one (.exp);
2) by graphic interface, by loading a powder diffraction pattern file;
3) by a command line.
1) by grafic interface, by creating a new EXPO2014 input file or loading an existing one (.exp)
To carry out the indexing process by EXPO2014 is it possible to edit a new input file (saving it with the extension .exp) or load/modify an existing one, created by EXPO2014 or by a text editor (see the chapter Preparing input file).
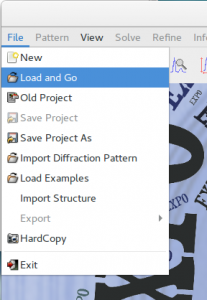
In case of an already created input file, load it from the menu File > Load & Go.
Use the button ![]() of the toolbar to carry out the steps of the indexing procedure.
of the toolbar to carry out the steps of the indexing procedure.
An example of input file for indexing the powder pattern of cimetidine is cime.exp, available at the directory examples (see the ‘Running examples’ at the EXPO2014 installation section):
%structure cime
%job cimetidine (C10H16N6S) -- Synchrotron data
%data
pattern cime.dat
wavelength 1.52904
synchrotron
%ntreor
%continue
The command that has to be introduced in the input file for carrying out the indexing process by N-TREOR09 is %ntreor. It must be added after the command %data. Add %continue if you want to carry out all the next steps of the structure determination process (see the section Commands of EXPO2014 for the description of the useful commands that can be introduced in the EXPO2014 input file).
The commands %dicvol and %mcmaille have to be used to perform the indexing by the program DICVOL06 and McMaille, respectively. For example, by loading the following EXPO2014 input file the cell determination step will be carried out, in sequence, by N-TREOR09, DICVOL06 and McMaille.
%structure cime
%job cimetidine (C10H16N6S) -- Synchrotron data
%data
pattern cime.dat
wavelength 1.52904
synchrotron
%ntreor
%dicvol
%mcmaille
%continue
2)Indexing by graphic interface, by loading a powder diffraction pattern file
In order to determine the unit cell by graphic interface, it is necessary:
a) to load the powder diffraction data file by the menu File > Import Diffraction Pattern (for the description of the formats of the counts files readable by EXPO2014 see the directive pattern of the command %data);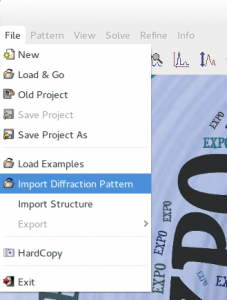
b) to set the type and the value of the experimental wavelength by the EXPO2014 dialogue window.
c) to select the indexing program from Pattern > Indexing.
As an example, load the counts file merca.xy, available at the directory examples, and supply the wavelength value 1.54056 Å.
If the program N-TREOR09 is chosen from Pattern > Indexing, the dialogue box shown in the following figure will be opened.
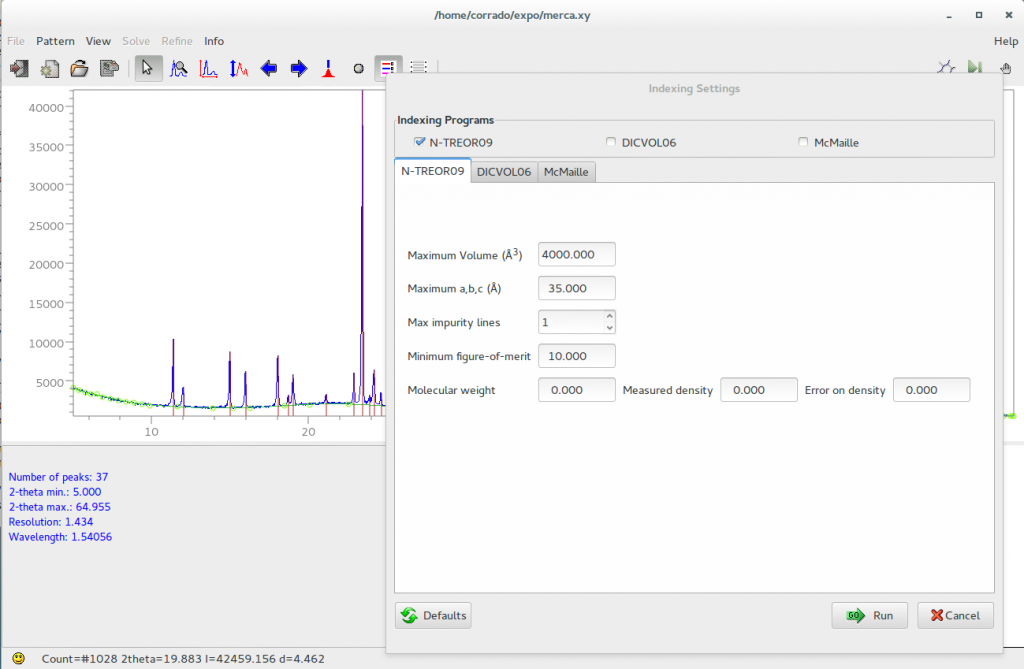
The default values of the maximum cell volume, the maximum cell axes, the maximum number of allowed impurity lines, the minimum figure of merit M20 (de Wolff, 1968) characterizing the candidate cells, can be changed by graphic interface. If available, it is possible to supply the measured density together with the corresponding error. Molecular weight is used only if the density value is not equal to zero.
N-TREOR09 documentation is available at http://www.ba.ic.cnr.it/softwareic/expo/ntreor/. By clicking on ‘Run’, EXPO2014 automatically creates a N-TREOR09 input file and executes N-TREOR09.
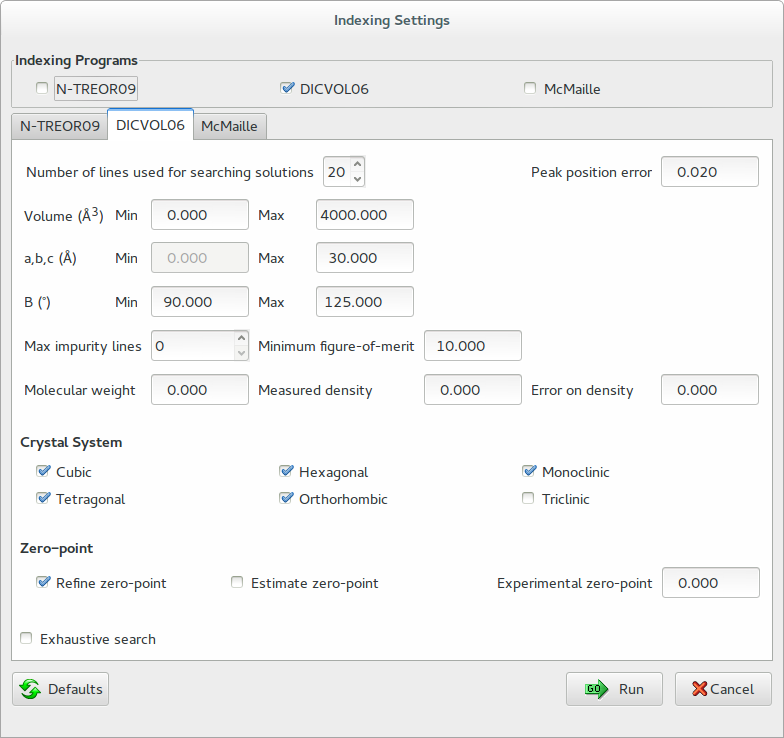
By ticking ‘DICVOL06’ in the frame ‘Indexing Programs’ it is also possible to activate the graphic interface for the indexing by DICVOL06 (see the following figure). In this case, by clicking on ‘Run’, EXPO2014 automatically creates a DICVOL06 input file and runs DICVOL06.
On Windows operating system the executable file dicvol06.exe is tipically located in the folder C:\Program Files\Expo2014\bin and corresponds to the program freely available at http://www.ccp14.ac.uk/ccp/web-mirrors/dicvol/. On Linux OS dicvol06.exe is located in expo_install_dir\bin (expo_install_dir is the directory where EXPO2014 has been installed). To run DICVOL06 under Linux OS, the Windows Emulator Wine is required. Wine is available at the software center of the most common linux distributions. DICVOL06 documentation can be found at http://www.ba.ic.cnr.it/softwareic/expo/dicvol06/.
By ticking ‘McMaille’ in the frame ‘Indexing Programs’, EXPO2014 activates the graphic interface for the indexing program McMaille version 4.00. Its documentation is available at http://www.cristal.org/McMaille/McMaille-v4.html.
Whatever the indexing program is graphically chosen, EXPO2014 automatically locates and visualizes peaks that will be used for finding the unit cell. The automatic peak search is skipped if peaks positions (in terms of “d” or 2θ values) are already available, e.g., because, before the selection of the indexing program, an external file of peaks has been graphically loaded (i.e., by selecting Pattern > Peaks > Load Peaks).
If the located peaks are reliable, clicking on ‘Run’ they are automatically refined and supplied to the indexing program to determine the unit cell. On the contrary, if changes of peaks are necessary press ‘Cancel’ to leave the ‘Indexing Setting’ window and modify the peaks selection by graphic interface (see the section Selecting peaks for indexing).
3)Indexing by using a command line
To execute the indexing procedure by a command line, the following sintax should be used:
expo followed by the filename of the powder diffraction data and the option -index=indexing_program, where indexing_program indicates the program(s) to be used for the indexing process (the variable indexing_program has to be equal to n in case of N-TREOR09, to d in case of DICVOL06 and to m in case of McMaille). For more infomation about the use of a command line see the section Command line usage of the EXPO2014 installation.
For example, the following command line
expo merca.xy -index=ndm
has to be typed to carry out the indexing of the powder diffraction pattern stored in the file merca.xy, by running, in sequence, N-TREOR09 (n), DICVOL06 (d) and McMaille (m).
Add the option -wavel=wavelength to supply the value of the wavelength used to collect the powder pattern. If -wavel is omitted the default wavelength is CuKα1 ( 1.54056 Å).
For example, if the following command line is used:
expo cime.dat -index=nd -wavel=1.52904
EXPO2014 carries out the indexing of the powder diffraction pattern stored in the file cime.dat (collected by using an experimental wavelength of 1.52904 Å) by executing N-TREOR09 (n) and DICVOL06 (d), in sequence.
The following additional options can be introduced in the command line:
-auto to avoid the user interaction with the EXPO2014 graphic interface and run the program in automatic way;
-nogui to run the indexing program(s) by deactivating the graphical interface. For example, by using the following command line:
expo cime.dat -index=n -wavel=1.52904 -nogui
EXPO2014 performs the indexing process by N-TREOR09 with no graphic interface.
Accurate and reliable peak detection is fundamental for the success of the powder pattern indexing. To detect peaks, EXPO2014 uses an approach based on background subtraction, profile smoothing and application of the second derivative method. The automatic peak search is extremely sensitive to noise and may suffer from misinterpretation of the background that can make inefficient the algorithm.
In order to check the reliability of the automatic peak search results, use the toolbar buttons ![]() to explore the pattern. If the automatic peak search outcome is not reliable, the peak selection can be modified in different ways:
to explore the pattern. If the automatic peak search outcome is not reliable, the peak selection can be modified in different ways:
1.By changing the curve describing the background. This is possible adding or removing the background points by pressing on the toolbar button ![]() and/or using left mouse click to add points and right mouse click to delete points. Background function can be also modified by the button
and/or using left mouse click to add points and right mouse click to delete points. Background function can be also modified by the button ![]() of the ‘Pattern’ option. When background is changed, the peak positions are automatically updated and visualized.
of the ‘Pattern’ option. When background is changed, the peak positions are automatically updated and visualized.
2.By choosing the toolbar button ![]() to add peaks (by left click of mouse) and/or remove peaks (by right click of mouse).
to add peaks (by left click of mouse) and/or remove peaks (by right click of mouse).
3.By the menu Pattern > Peaks > Peak Search Conditions. The button ‘Peak Search Conditions’ opens a window that enables to modify the main search conditions. All peaks with percentage intensity larger than or equal to ‘% Int. Threshold’ will be selected. 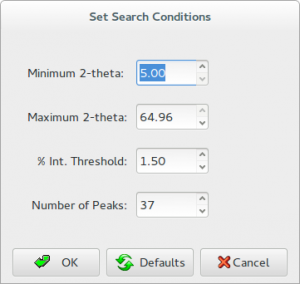
4.Select Pattern > Peaks > Peak List to have access to the list of peaks; for each of them the following values are provided: 2θ, d, intensity (calculated removing the contribution of background), full width at half maximum (FWHM). This window can be used to edit the 2θ or d values (peak intensity and FWHM values cannot be modified) and to add or delete peaks. If you click on a row in the list, the corresponding peak will be marked with a tick.
5.Use Pattern > Peaks > Load Peaks / Save Peaks to load or save peaks as 2θ or d values.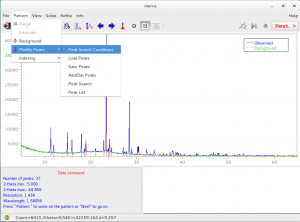
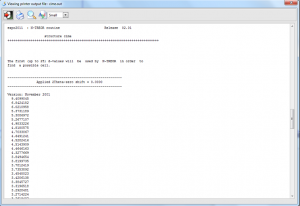
To have access to the output file it is possible to
– select Info > View Output file, or
– open the file name.out (where name is the name defined by the command %structure, if an input file .exp has been loaded, or is the filename of the powder diffraction file without its extension, if the indexing has been carried out by loading this file by graphic interface) with a text editor, or
– click on the button ![]() of the main menu.
of the main menu.
Additional output files are created by the specific indexing programs and are accessible through the menu Pattern > Indexing > Output. Among the additional input and output files that can be found in the working directory: name.new (where name is the name defined by the command %structure, if an input file .exp has been loaded, or is the filename of the powder diffraction file without its extension, if the indexing has been carried out by loading this file by graphic interface), condens.out and ntreor.out in case of N-TREOR09; dicvol_inp, dicvol_out in case of DICVOL06; mcmaille.dat, mcmaille.imp, mcmaille.mcm in case of McMaille.
Directives in the command %ntreor
The default choices of N-TREOR09 can be changed via suitable directives of the command %ntreor .
All the directives of the indexing program TREOR (Werner, Eriksson & Westdahl, 1985) are valid for the command %ntreor and have to be used with the same syntax (see the N-TREOR09 manual for details).
Directives in the command %data, useful for the indexing process
The following directives of the command %data can be used to supply a suitable list of peaks to the indexing process:
The indexing problem can be usually solved by using the first (in terms of  values) 25 peaks (even very weak peaks included). Peaks at low angle not clearly resolved and with an appreciable peak width should be not included to avoid to supply to the indexing program not well positioned peaks.
In case of indexing failure try by different attempts, gradually eliminating suspicious Bragg peaks (e.g., the weakest peaks or peaks on a shoulder) and check if it results in a success of the indexing process. The failure could be due to the presence of impurity peaks and/or to the absence of one or more useful peaks. Sometimes, if weak peaks are missed, it could be useful to change the search conditions by reducing the intensity threshold value. On the other hand, in case of presence of an impurity phase, if it is a minority phase, it could be useful to select the most intense peaks (about 20 peaks are usually enough). Indexing program like N-TREOR09 and DICVOL06 can successfully index a powder diffraction pattern even if some peaks are omitted but they can fail if a lot of wrong or misplaced peaks are selected for the cell determination process.
Once the peaks have been located, the next step is the automatic refinement of peak positions and profile parameters (a Pearson VII profile function is used). At the end of the refinement a file named name.pea (where name is the structure name), containing the refined d values associated to the selected peaks, is automatically created by the program. This file can be used to skip the peak search procedure (see the directive extefile) if a new indexing process is performed.
At the end of the indexing procedure the graphic interface supplies a list containing, for each solution, the used indexing program (N for N-TREOR09, D for DICVOL06, M for McMaille), the cell parameters and the cell volume, the classical figure of merit M20 (de Wolff, 1968), the applied zero-shift, the number of unindexed lines (NIX), the symmetry information. In case of N-TREOR09, the figure of merit FOMnew (Altomare et al., 2009) is provided and the symmetry information concerns the most probable extinction symbol. In case of indexing by McMaille the figure of merit McM20 is displayed (see the following figure).
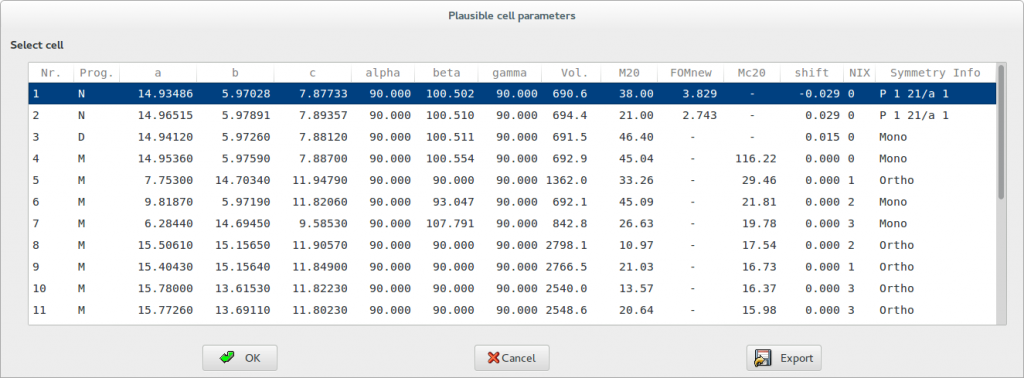
If more plausible cells are suggested and more than one indexing program has been applied, for each indexing program the cells are ranked according to its reference figure of merit. When the quality of data is not good, uncertainty on the indexing procedure can lead to more than one solution that should be carefully examined, in particular if their figures of merit are not encouraging. Clicking on each suggested cell of the list, the tick marks at the bottom of the experimental pattern, indicating the calculated positions of the Bragg reflections, will be displayed. The tick marks must correspond to peaks in the pattern. When no experimental peaks are associated to the tick mark, the corresponding reflection is probably systematically absent. On the other side, if a diffraction peak in the pattern is not associated to any tick, the peak can be referred to an impurity phase or the candidate cell is wrong. The unindexed lines are highlighted by small full circles above the peak.
If more cells are available at the end of indexing they are saved and always accessible from Pattern> Indexing> Cell List.
The reliability of indexing is assessed by means of numerical figures of merit. The figures of merit reported by EXPO2014 are M20, FOMnew only for N-TREOR09, M20 for DICVOL06 and McM20 only for McMaille. Consult the output file of the specific program (Select Pattern > Indexing > Output) to have a look at additional figures of merit (e.g., F20) for each solution.
In case of M20, the rule suggested by de Wolff is the following one: if M20 > 10 and the number of unindexed lines, among the first twenty ones, is not larger than 2 the indexing process is reliable and substantially correct; exceptions to this rule can be possible. In case of high quality data (e.g., synchrotron data) the M20 of the correct cell is usually much larger than 10; in case of laboratory data the correct solution can be characterized by M20 value not so larger than 10.
The possibility of running more than one indexing program enhances the indexing power of EXPO2014: if one of the indexing programs fails it is possible that another one (at least) can succeed.
In addition, similar results obtained by different programs strengthen the confidence in the correctness of the cell. N-TREOR09 and DICVOL06 usually run much faster than McMaille, it is better to apply them first.
N-TREOR09 includes some features in the default strategy:
– it performs an automatic correction of the 2θ zero-shift;
– it may successfully index by default powder diffraction patterns containing one impurity peak;
– starting the search in the cubic system, if an acceptable solution is not found the program explores all the rest of crystal systems up to triclinic and stops as soon as a plausible solution has been found.
In case of DICVOL06 and McMaille these features are not included in the default strategy and should be enabled by user in the graphical interface when a preliminary indexing fails.
The search of triclinic cell can take a long time depending on the indexing program.
Once the indexing step has been carried out, you may perform the space group determination step by selecting the cell parameters and by clicking on the OK button. The following dialog window will appear: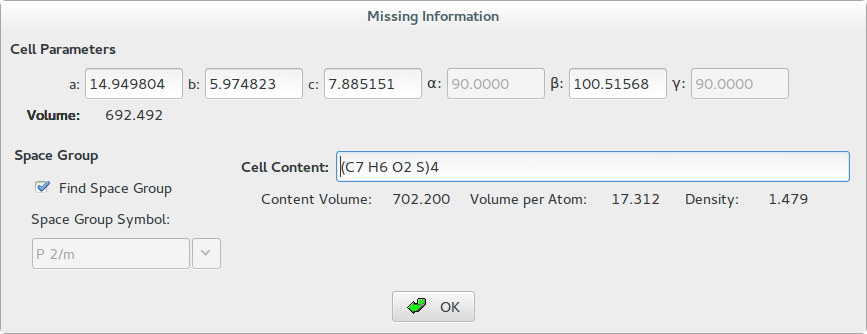
Before clicking OK, in this window you must specify the unit cell content. In the case of the 2-Mercaptobenzoic acid structure the cell volume suggests that the cell can accommodate 4 molecules of C7H6O2S (Z=4) and the cell content may be written as (C7 H6 O2 S)4.
During the editing of the cell content, the program calculates and displays a rough estimate of the following quantities:
1. Content Volume: an approximate value of the cell volume calculated as summation of the average atomic volumes associated to the supplied atoms. Its value is expected to be close the cell volume calculated directly by cell dimensions and reported in the window below the cell parameters. A table of the average volume of the atoms is reported in Appendix A.
2. Volume per Atom: the average volume for non-hydrogen atoms in the crystal structure calculated as ratio between the cell volume and the number of non-hydrogen atoms. Its value is expected to be close to 18 Å3 (18 Å3 rule) but sensible deviations from this ideal value can be observed due, for example, to the presence of H-bonding or large void spaces (e.g., in case of zeolites) in the crystal structure. A reasonable range is 15-22 Å3.
3. Density: is the density calculated by the mass of supplied atoms and the cell volume (g/cm3). Keep in mind that the density of molecular compound is relatively low and lying to the range 0.9-2.0 g/cm3.
Examples
Example 1:
The following example concerns a zeolite structure, characterized by a large cell axis (73.6505 Å) and cell volume (7194.74 Å3).
vni.pea is an ASCII file containing the interplanar distances (d) to be supplied to N-TREOR09 (the peak-search step is skipped).
A default indexing run is not able to find the correct cell, due to the default limits concerning the maximum value for the cell axes and cell volume (i.e., 35 Å and 4000 Å3, respectively). In order to increase these limits the directives cem = 80, (i.e., maximum allowed value for cell axes set to 80 Å) and vol = 10000, (i.e., maximum allowed value for the cell volume set to 10000 Å3) have been introduced in the input file, (see the documentation of N-TREOR09, available at http://www.ba.ic.cnr.it/softwareic/expo/ntreor/)
The additional directive nix=0, states that the maximum allowed number of unindexed lines (nix) should be zero (the default value for nix is one), i.e., only cells with no unindexed lines will be considered as plausible by N-TREOR09.
%structure vni
%job vni - Synchrotron data
%data
pattern vni.pow
wavelength 0.99975
synchrotron
extefile vni.pea
%ntreor
vol=10000,cem = 80, nix=0,
%continue
Example 2:
The maximum number of the allowed unindexed lines is set to 3 (nix=3,). The counts file format is not the default one.
%structure norbo_ag
%job norbo_ag - C7H10 - T = 85 K
%data
pattern norbo_ag.pow
filetype double
wavelength 0.85041
synchrotron
%ntreor
nix=3,
%continue
References
Altomare, A., Campi, G., Cuocci, C., Eriksson, L., Giacovazzo, C., Moliterni, A., Rizzi, R. & Werner, P.-E. (2009). J. Appl. Cryst. 42, 768-775.
Altomare, A., Giacovazzo, C., Guagliardi, A., Moliterni, A. G. G., Rizzi, R. & Werner, P.-E. (2000). J. Appl. Cryst. 33, 1180-1186.
Boultif, A., Louër, D., (2004). J. Appl. Cryst. 37, 724-731.
Le Bail, A., (2004). Powder Diffraction 19, 249-254.
Le Bail, A., Clearfield, J. H. Reibenspies & N. Bhuvanesh, (2008). Principles and Applications of Powder Diffraction 261–309.
De Wolff, P. M.(1968). J. Appl. Cryst. 1, 108-113.
Werner, P.-E., Eriksson, L., & Westdahl, M. (1985). J. Appl. Cryst. 18, 367-370.