To run the program it is necessary to create an input file with .sir extension using a text editor or the graphical tools (see The Graphic Interface).
Moreover it is now possible to start Sir2019 using a .ins file under the following conditions:
- the .ins file must contain at least the keywords: CELL, UNIT, LATT, SFAC (only atomic species), HKLF;
- in the same directory of the .ins file the .hkl file must exist with the same name.
The corresponding .sir file is automatically created by the program.
Let’s use, as an example, a simple small molecule (loganin) supplied as example with the program. To load it:
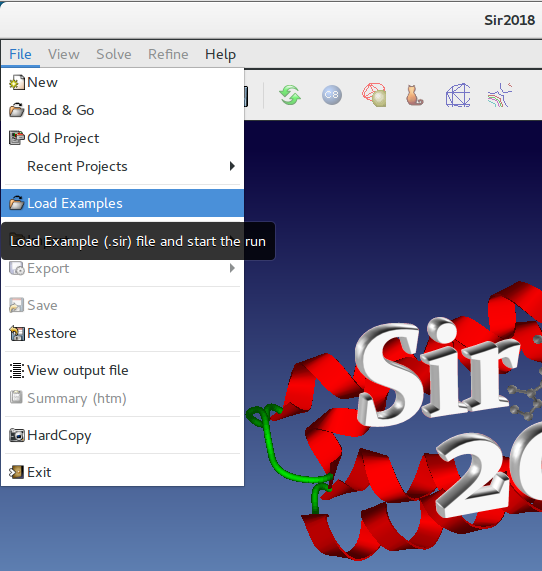
Select the input file for the test structure: loganin.sir
for ab initio: small and medium size molecules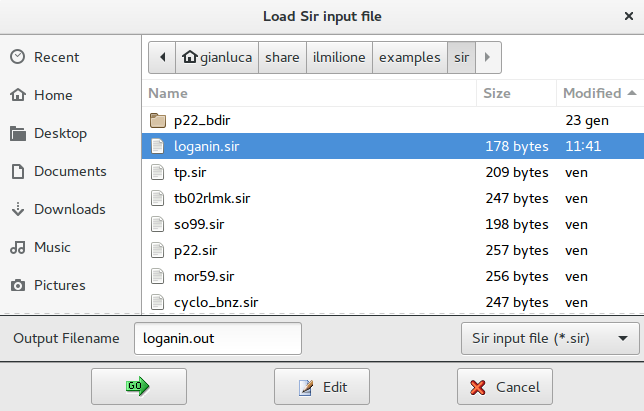
It is possible to visualize and to edit this file using the ![]() button. for ab initio: small and medium size molecules
button. for ab initio: small and medium size molecules
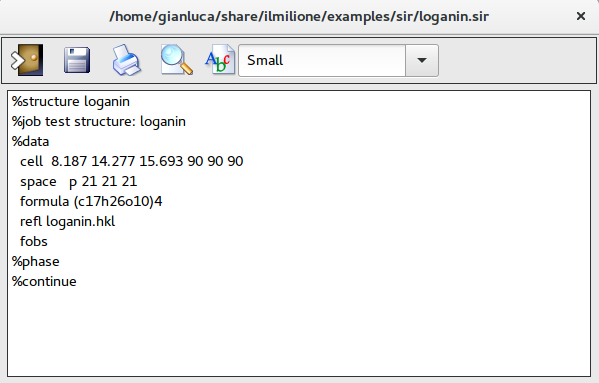
The file loganin.sir contains the minimal input instructions to make Sir2019 run. Only few commands and directives are mandatory: pay attention to structural info (i.e. cell parameters, space group, …), chemical composition (i.e. chemical content in the unit cell, ...) and experimental data (i.e. reflection file, type of data – structure factors or intensities, …).
 for ab initio: small and medium size molecules for ab initio: small and medium size molecules
To save changes click on ![]() ; leave this window using
; leave this window using ![]() . To start the program, click on
. To start the program, click on ![]() button.
button.
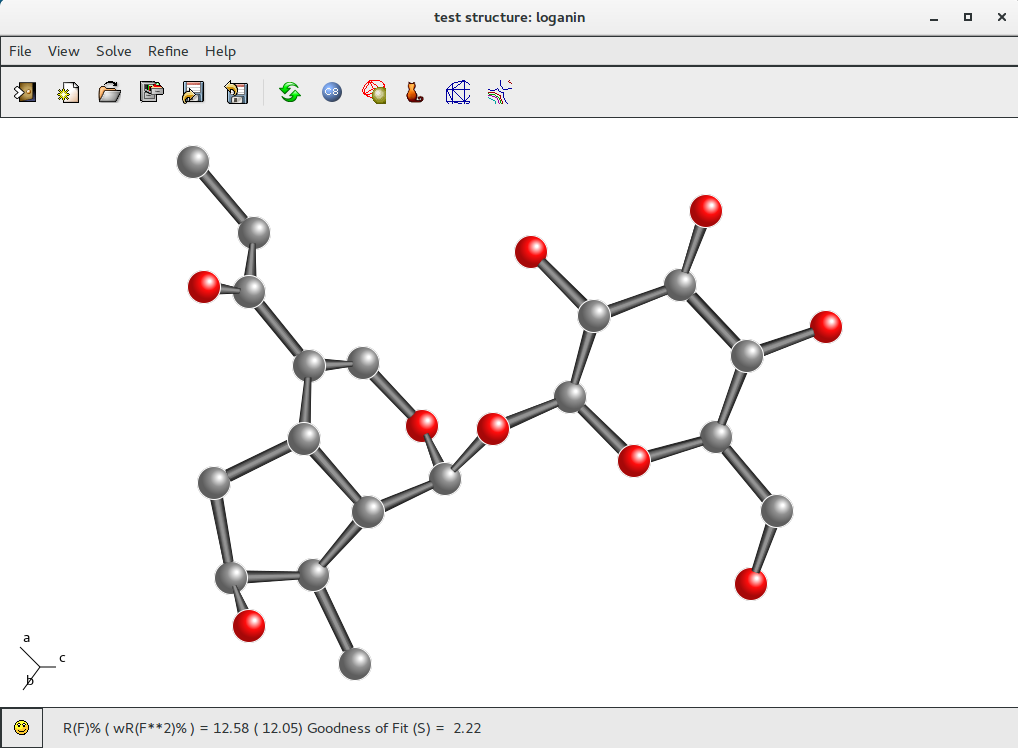
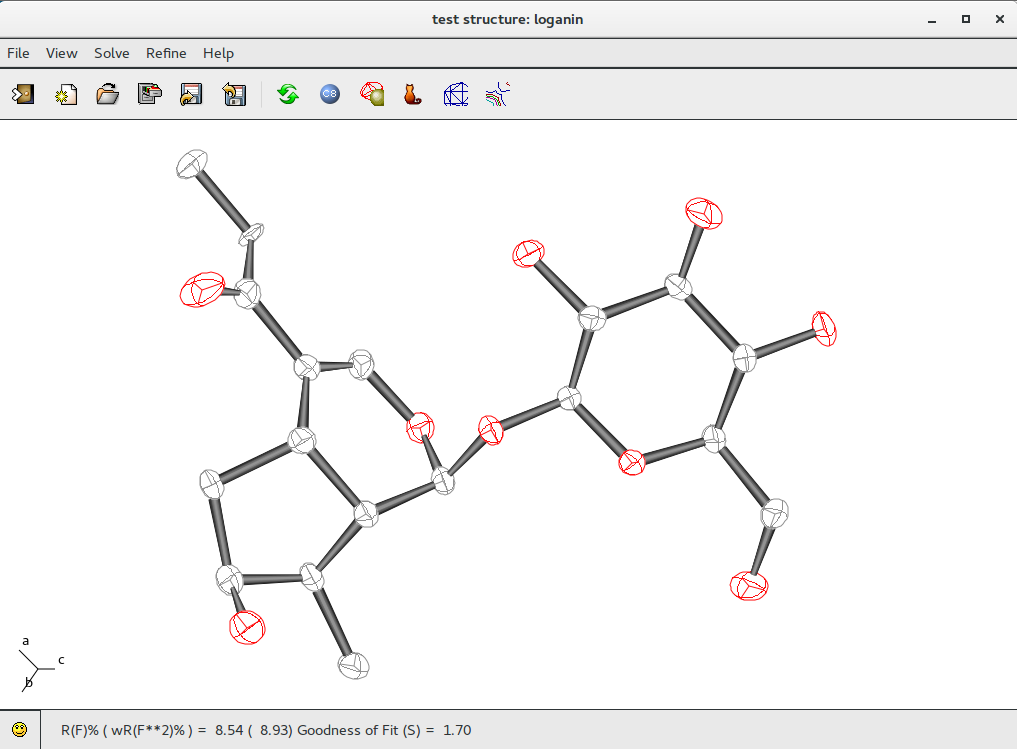
At the end of the run, Sir2019 shows the “best” model of the structure; the final R(F)% = 15.12 is quoted in the status bar (at the bottom of the program window).
 for ab initio: small and medium size molecules for ab initio: small and medium size molecules
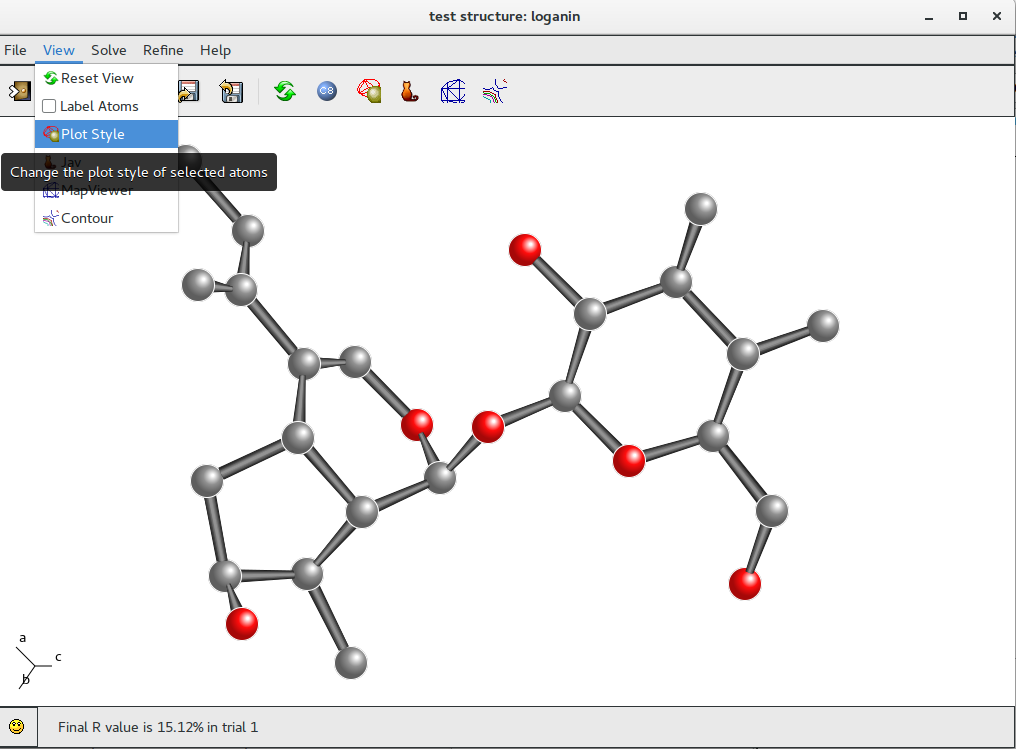
To modify the style go to menu item “View” on the main toolbar and select “Plot Style”option.
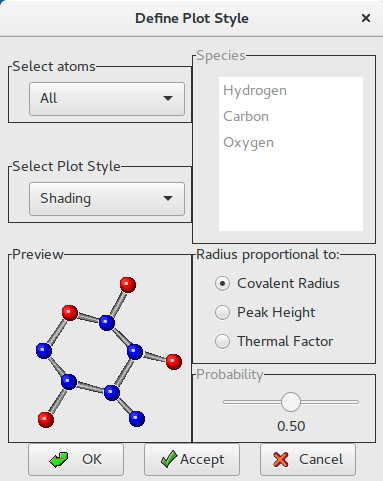
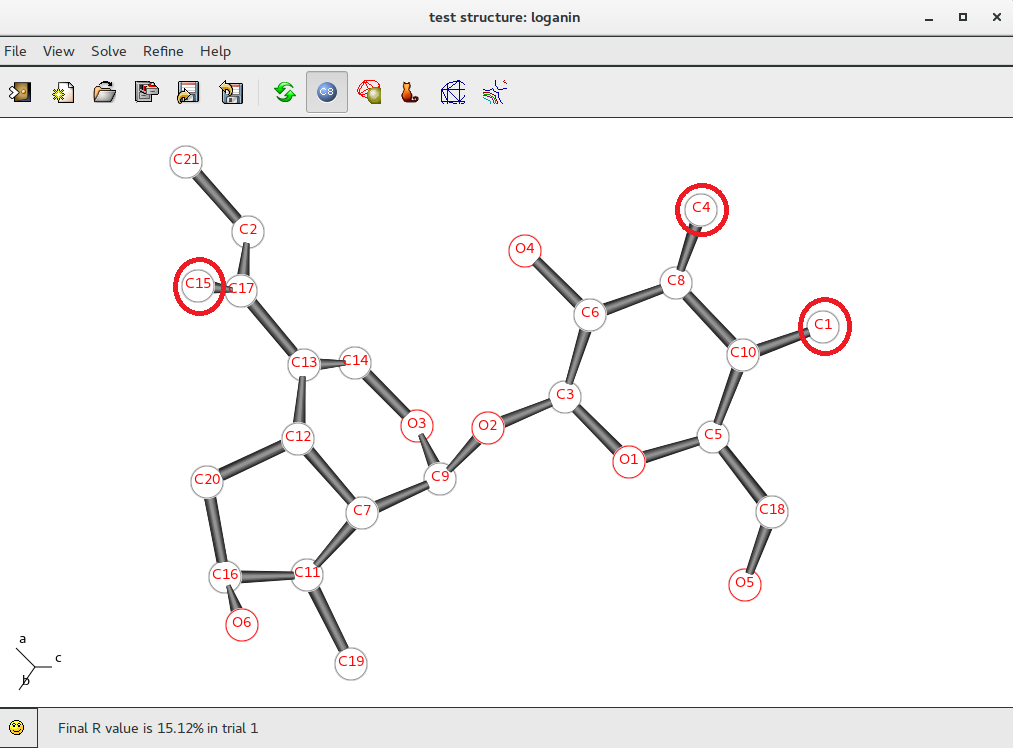
Change the plot style for the model (i.e. Bubbles) and accept it (click on Accept or OK buttons); add the labels (chemical species and progressive numbers) to the atoms of the model by clicking on Labels button ![]() :
:
 for ab initio: small and medium size molecules
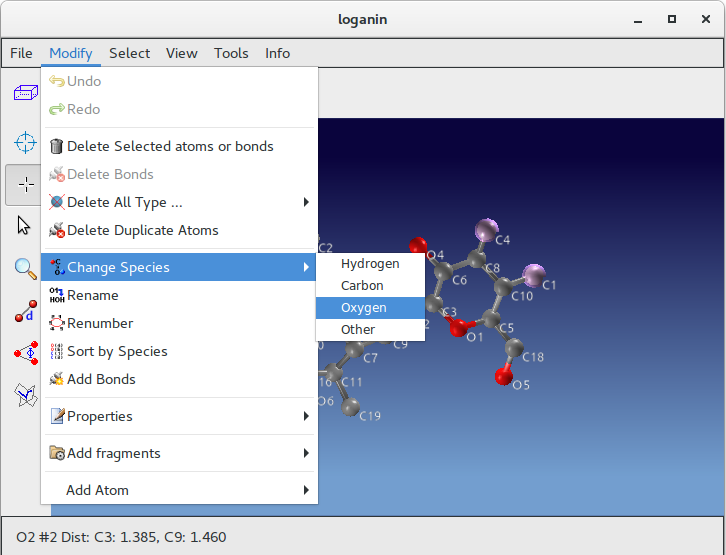
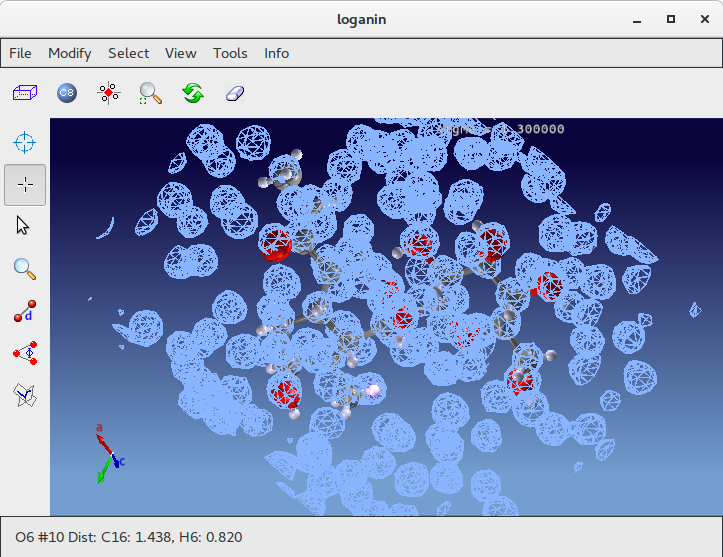
Atoms C1, C4 and C15 (inside red circles) show wrong labelling, they should be oxigens. To change their atomic species start ![]() Jav and click on Selection Mode button:
Jav and click on Selection Mode button:
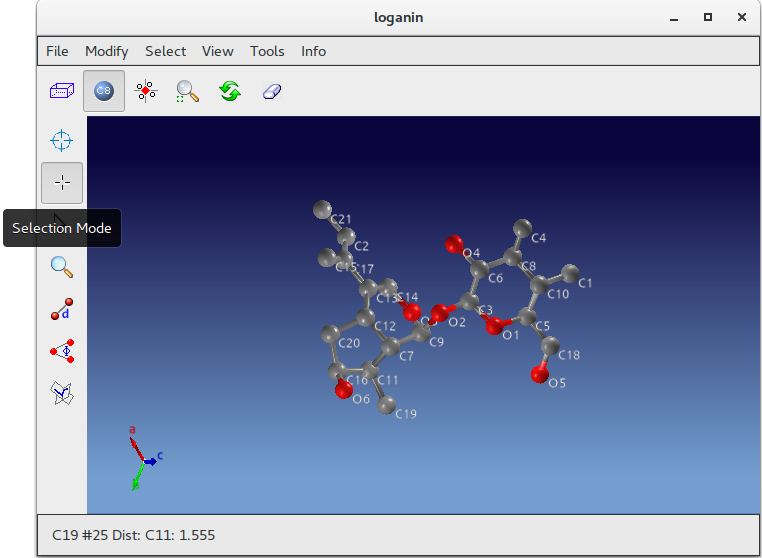
Using the mouse select C1, C4 and C15; go to menu item “Modify” on the toolbar; select “Change Species” and then “Oxigen”.
Start the refining process: go to menu item “Refine” on the Sir2019 toolbar and select LSQ option: the Least Square Refinement interface will be opened.
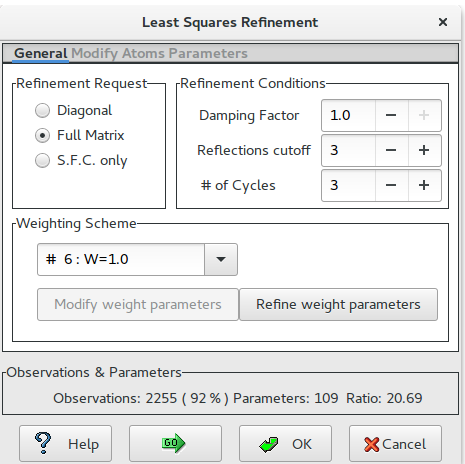
Set the LSQ options (i.e. Full Matrix, sigma(Fo) cutoff, number of LSQ cycles, weighting scheme, …)
Be careful to the ratio Observation / (number of refined) Parameters. For this example the ratio value (20.69) is high enough to lead to a reliable LSQ refinement. In general, the variance of the final LSQ parameters increases with decreasing values of the ratio: too small values of it can make the refining process meaningless even if the crystallographic residual is small.
Accept the choices clicking on ![]() button; the LSQ refinement will start.
button; the LSQ refinement will start.
The first step (after the changes of atomic species when necessary), is an isotropic LSQ refinement for all the model atoms (only coordinates and isotropic thermal factor will be refined: four parameters per atom) plus the scale factor.
Updated Rf% value can be found in the status bar: R(F)% = 12.58). The new Rf% value is lower than the previous one (Rf% = 15.12). This mean that modified labeling is correct; otherwise the new Rf% value should be larger than the previous one.
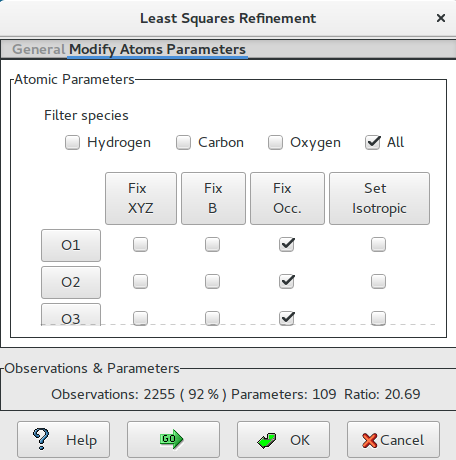
To improve the reliability of the atomic model, it has to be applied a thermal anisotropic LSQ refinement. If necessary it is possible to fix some specific atomic parameters.
Restart the LSQ interface and select “Modify Atoms Parameters”; choose the filter (i.e. All) and select the option (i.e Set Isotropic: No). Atomic coordinates and anisotropic thermal parameters will be refined: nine parameters per atom). ![]() to restart calculations.
to restart calculations.
Change the plot style for the model: go to menu item “View” and select “Plot Style”option: select “Ellipsoids” and radius proportional to Thermal Factor (atom thermal ellipsoids will be plotted, proportional to anisotropic thermal parameters). Updated R(F)% = 8.54 can be found in the status bar .
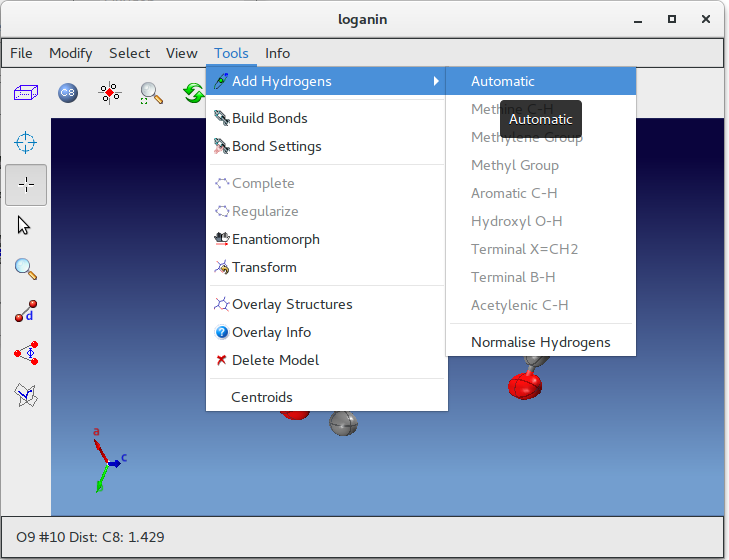
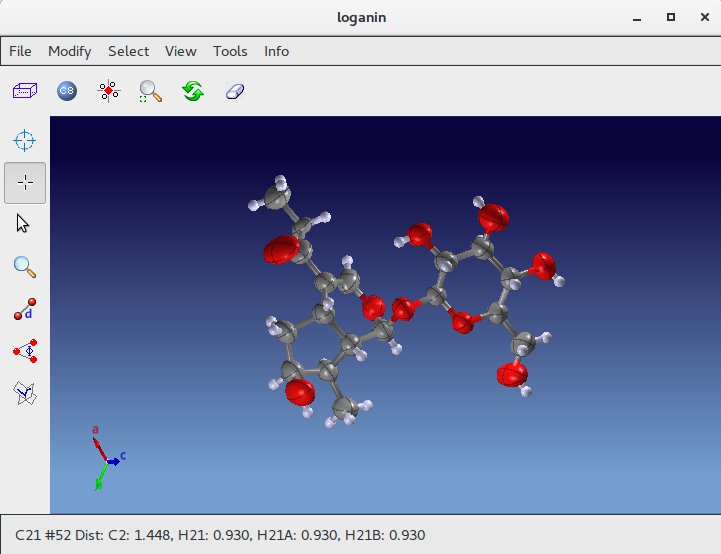
Complete the model by adding hydrogen atoms using the “Tools” menu in ![]() Jav:
Jav:
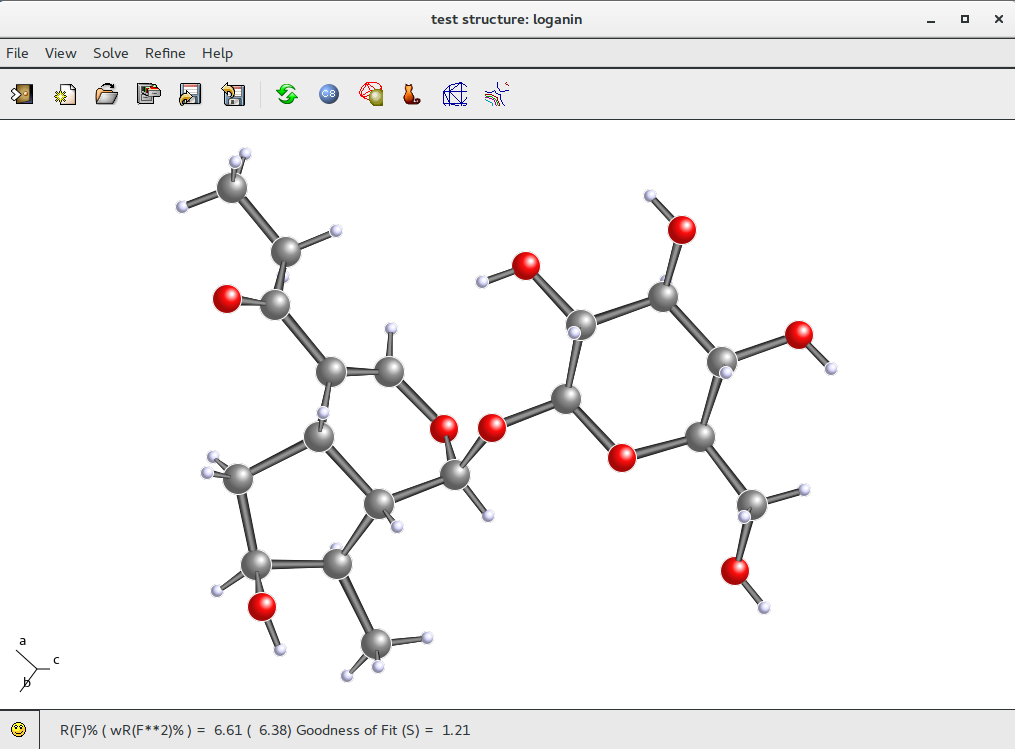
The next step is to start a new LSQ refiniment. Updated R(F)% value is shown in the status bar . This R(F)% value (6.61) is low enough to suggest that the atomic model is correct.
Using Jav, it is possible to visualize the electron density map and the related model; click on the button ![]() in the toolbar :
in the toolbar :
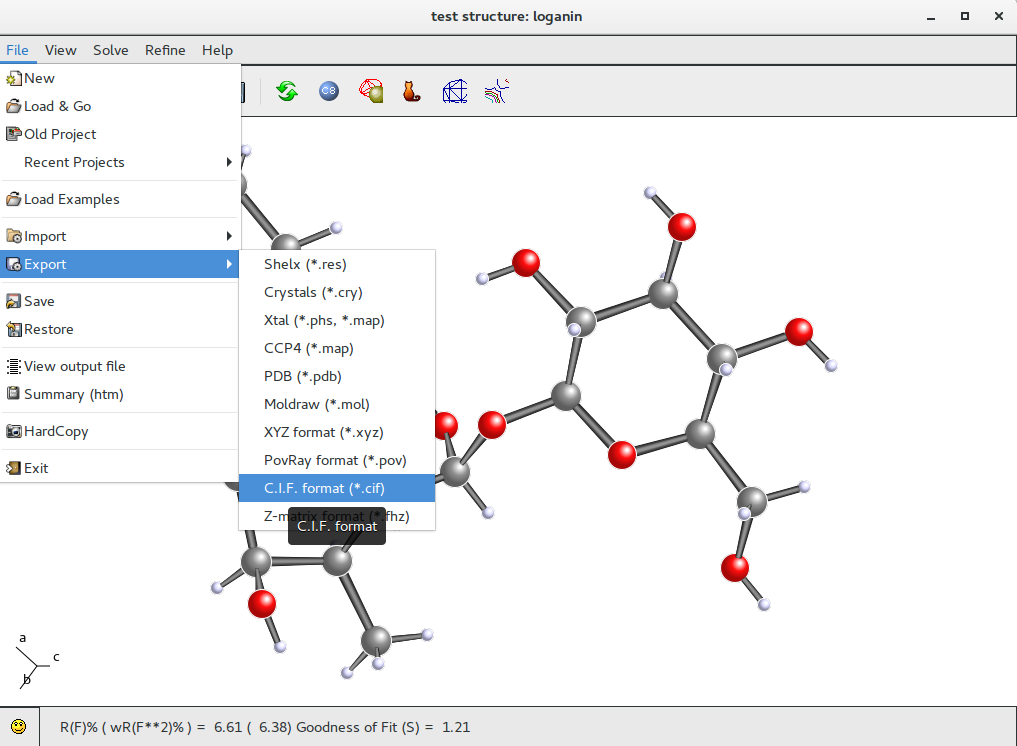
It is possible to export data and results in order to use them in another program; in particular, when the refinement is complete and the structure is ready for publication, it is possible to export data and results in CIF format.
Go to menu item “File” on the toolbar, select “Export” option and then CIF option (other formats are available: i.e. PDB format, for proteins).