Sir2019 uses a two step phasing technique (Pälher et al., 1990; Terwilliger, 1994a,b; Sheldrick, 1998; Burla et al., 2002b; Burla et al. 2007). First, the parameters defining the anomalous scatterer substructure are determined, and then the protein phases are assigned and refined.
The program may treat up to four wavelengths. The phasing procedure is based on the following mathematical techniques.
The expected conditional value
![]() is derived from the joint probability distribution (Burla et al., 2002b, 2003b)
is derived from the joint probability distribution (Burla et al., 2002b, 2003b)
![]()
where R‘s are the amplitudes of the normalized structure factors at the various wavelengths and φ are the corresponding phases. R0a is the normalized amplitude of the structure factor corresponding to the anomalous scatterer substructure, calculated by neglecting the anomalous dispersion effects on the scattering factors; φ0a is the corresponding phase value.
![]() is considered to be the best estimate of R0a, and therefore may be used in two ways for recovering the anomalous substructure: by tangent procedures or by Patterson deconvolution techniques. In our tests we always use the second approach, which is the default choice of Sir2019.
is considered to be the best estimate of R0a, and therefore may be used in two ways for recovering the anomalous substructure: by tangent procedures or by Patterson deconvolution techniques. In our tests we always use the second approach, which is the default choice of Sir2019.
An algorithm is automatically used (default mode) for limiting data resolution and for predicting the most informative wavelength combinations in a MAD experiment.
Once a model structure is found (actually the program provides 30 model candidates ranked by a FOM, but only the best ten will be used for phasing), the program applies an automatic least squares procedure for improving the substructure parameters and for refining Δf’ and Δf” values (Giacovazzo & Siliqi, 2004; see also Otwinowski, 1991). The information so gained is used in the second phasing step, where the protein phases are estimated from the experimental anomalous dispersion effects. Such phases are assigned according to the probability distribution function
![]()
where φp is the protein phase to assign, Ra and φa (supposed to be well estimated at this step) are the normalized amplitudes and phases of the anomalous substructures.
The protein phases φp so estimated are used as starting set for the application of the EDM-VLD-FL– techniques before described.
In order to automatically run the full process the user is only asked to submit the experimental data in terms of all the data sets (four columns for each wavelength and the native dataset when available), the atomic species of the anomalous scatterers, the estimated/expected number of them in the asymmetric unit, the corresponding Δf’ and Δf” values expected at the experimental wavelengths, and the information about the unit cell content of the protein. This last may be given by specifying the number of residues, or the protein sequence or the overall molecular weight.
It is also possible to decide the best strategy for the parameters to be refined.
It is possible to create the input file for Sir2019 using a text editor; in the following example the CAB procedure will use Buccaneer to complete and refine the model:
%structure ttg
%CAB buccaneer
%job THERMUS THERMOPHILUS GROEL – PDB: 1SRV
%data
mtz ttg.mtz
label H K L FP SIGFP F(+)SE1 SIGF(+)SE1 F(-)SE1 SIGF(-)SE1 F(+)SE2 SIGF(+)SE2 F(-)SE2 SIGF(-)SE2 F(+)SE3 SIGF(+)SE3 F(-)SE3 SIGF(-)SE3 F(+)SE4 SIGF(+)SE4 F(-)SE4 SIGF(-)SE4
sequence 1srv.seq
nMolecules 1
anomalous Se 3 -1.805 0.646 -8.582 3.843 -7.663 3.841 -2.618 3.578
native
%mad
%end
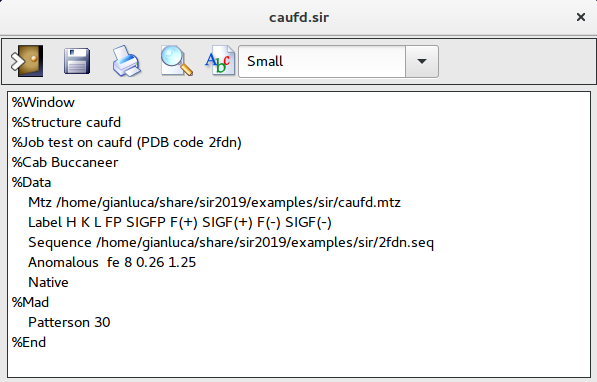
An example of SAD data follows:
%struct caufd
%job SAD test structure caufd (pdb code 2FDN)
%data
mtz caufd.mtz
label H K L FP SIGFP F(+) SIGF(+) F(-) SIGF(-)
native
sequence caufd.seq
nMolecules 1
anom fe 8 0.26 1.25
%mad
%end
A graphic interface is available in Sir2019 to work with SAD/MAD structure determination by means of the New item ![]() in the toolbar or in the menu File :
in the toolbar or in the menu File :
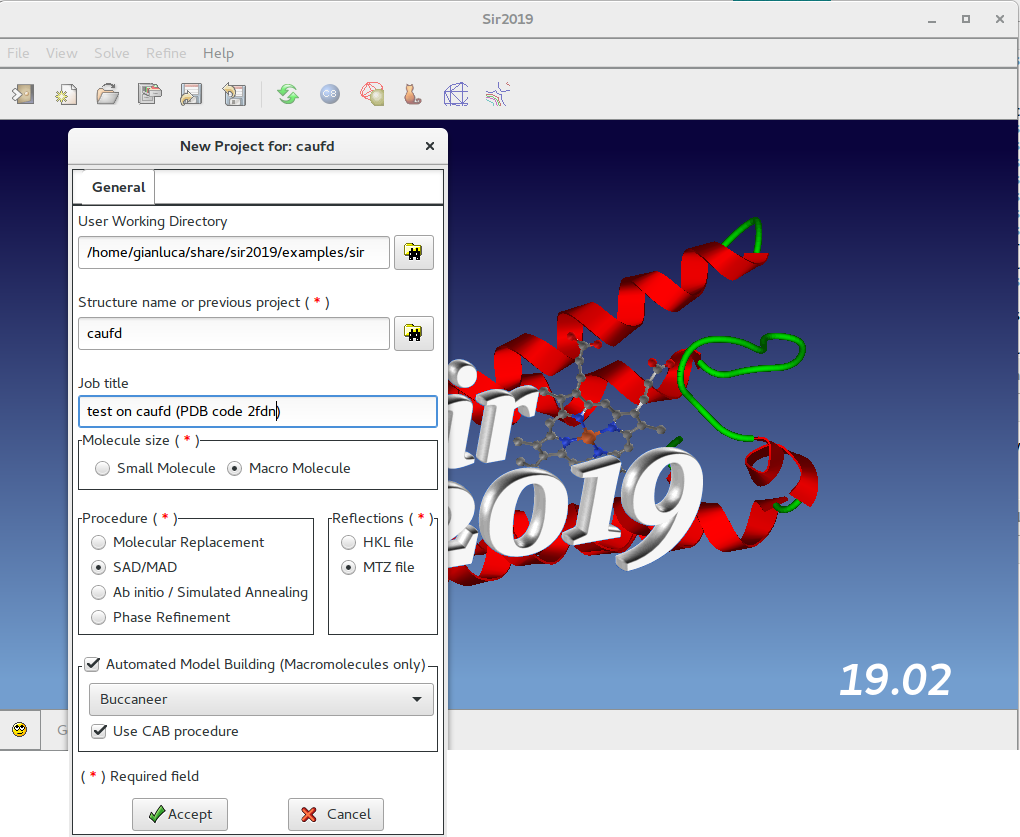
In this window the user should specify, among others, the working directory, the molecule size, the procedure to use (SAD/MAD) and the reflection file format (MTZ).
Macromolecules only: if an Automated Model Building (AMB) program is installed, it is possible to use it by selecting Buccaneer or Nautilus or ARP/wARP or Phenix. It will be used in CAB procedure if selected.
Once clicked on ![]() it is possible to access the MTZ section:
it is possible to access the MTZ section:
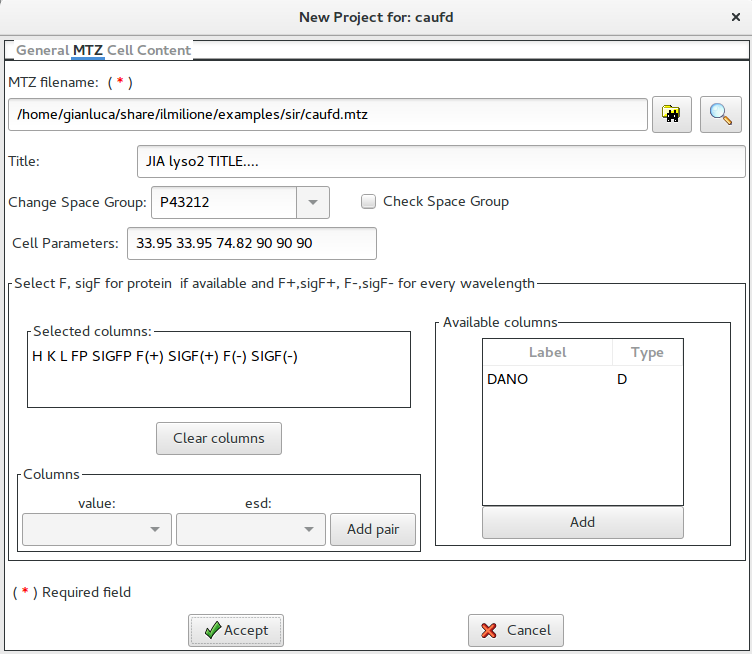
This form is used to get all the information from an MTZ file. Once browsed, it is possible to view the available columns.
The user can add, when available, the two columns for F and sigma(F) with data without anomalous information (native date). For every wavelenght the pair columns F+ / sig(F+) and F- / sig(F-) are necessary (four columns per wavelenght). .
If necessary it is possible to specify a different space group; the user can just write the new symbol or to select it from a list. It is also possible to check the possible space group (see here).
Once clicked on ![]() it is possible to access the Cell Content section:
it is possible to access the Cell Content section:
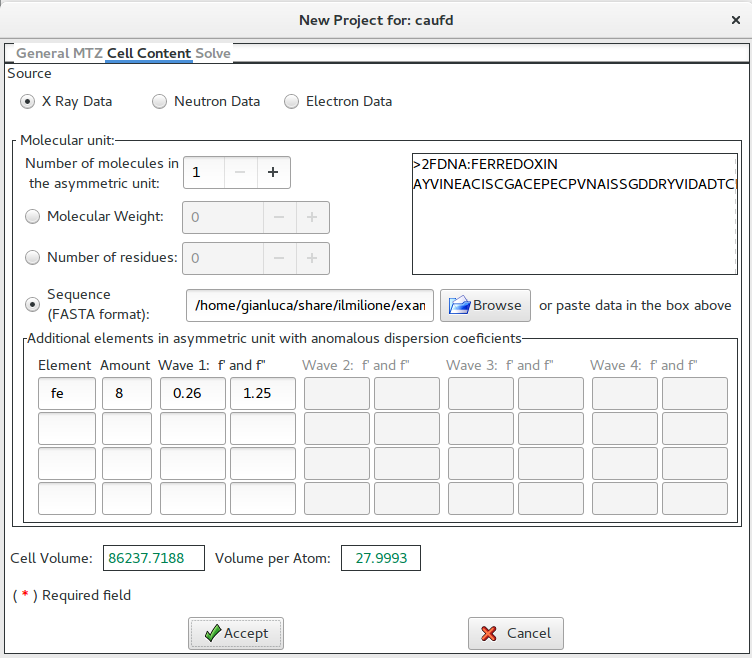
This form is used to supply the cell content. It is possible to specify the number of molecules in asymmetric unit.
The chemical content can be specified trough the weight or the number of residues or the sequence (in FASTA format); the sequence can be stored in a file or pasted directly in the box (up right part of the form). In this example, the sequence (in FASTA format) has been supplied.
The program needs to know an approximate number of anomalous species and the value for f’ and f” for all the wavelenghs supplied in the previous window.
Once clicked on ![]() it is possible to access the Solve section:
it is possible to access the Solve section:
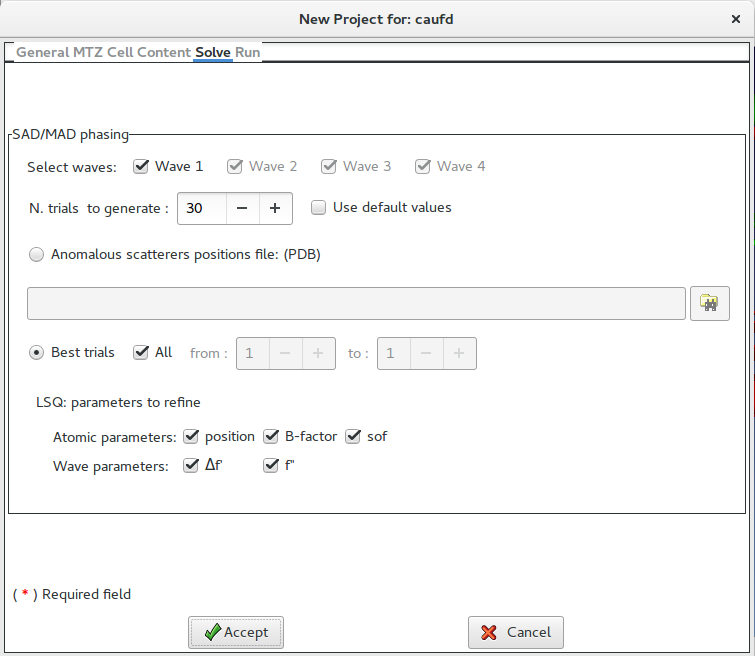
The strategy for the structure solution is defined in this form. It is possible to select which wavelengh has to be used (all in default). The program will use the Patterson approach to find the substructures; it is possible to specify the number of trials to be used or relay on its default value.
As an alternative to the substructures calculation it is possible to supply a PDB file.
Once clicked on ![]() it is possible to access the Runsection:
it is possible to access the Runsection:
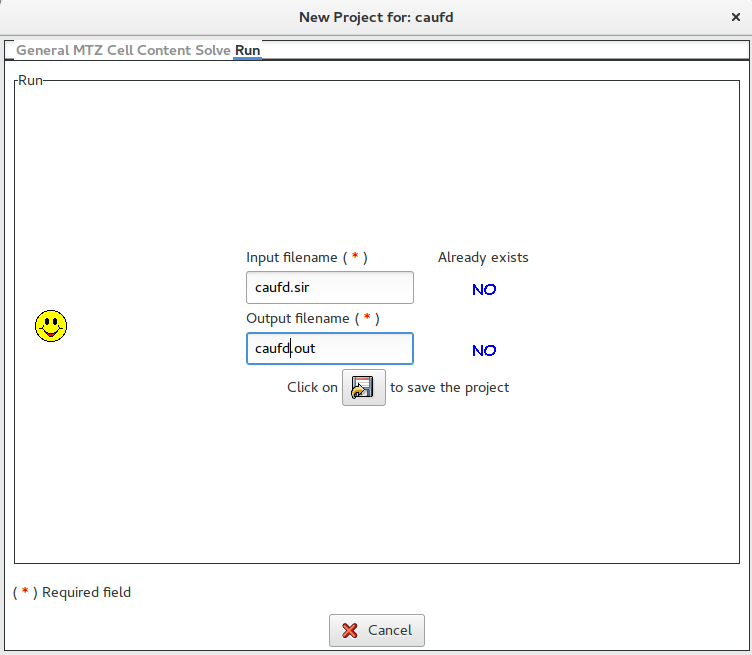
If Graphic window required is checked, a graphical output will be produced (see below).
In this section it is possible to change the default names for the input (project) and for the output file. The user, by clicking on ![]() button, can save the input file for Sir2019.
button, can save the input file for Sir2019.

Now it is possible to edit ![]() the input file (caufd.sir in this example):
the input file (caufd.sir in this example):
To start calculations click on ![]() .
.
Once the program is over, by means of the “View output file” ![]() feature in “File” it is possible to access the complete output file.
feature in “File” it is possible to access the complete output file.
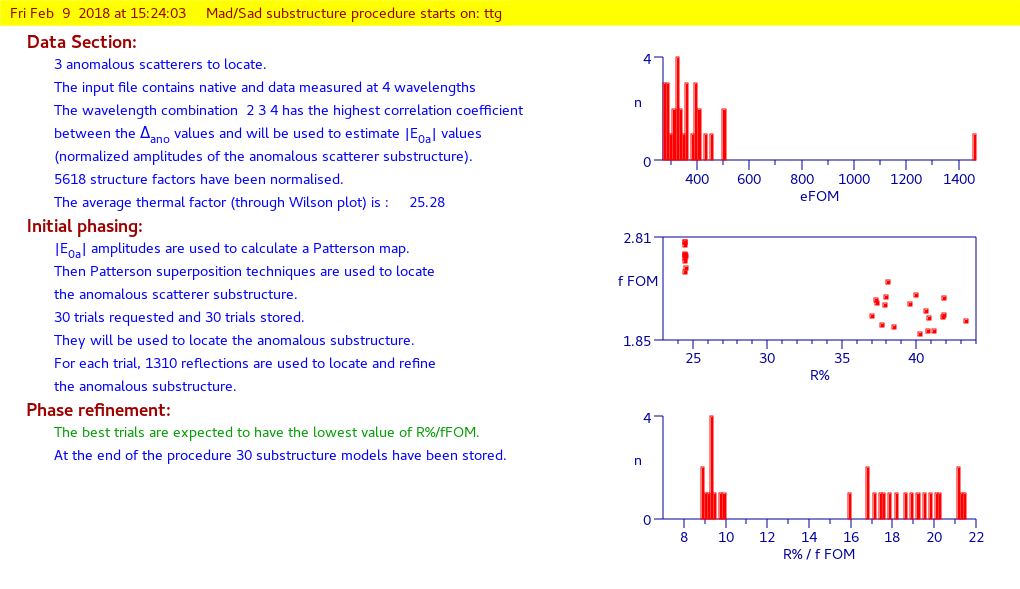
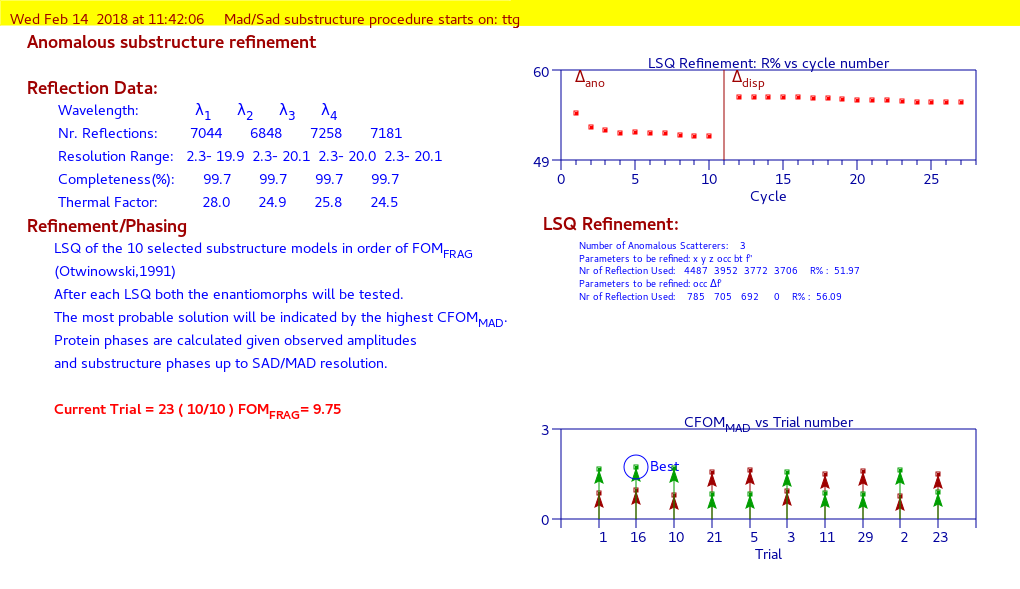
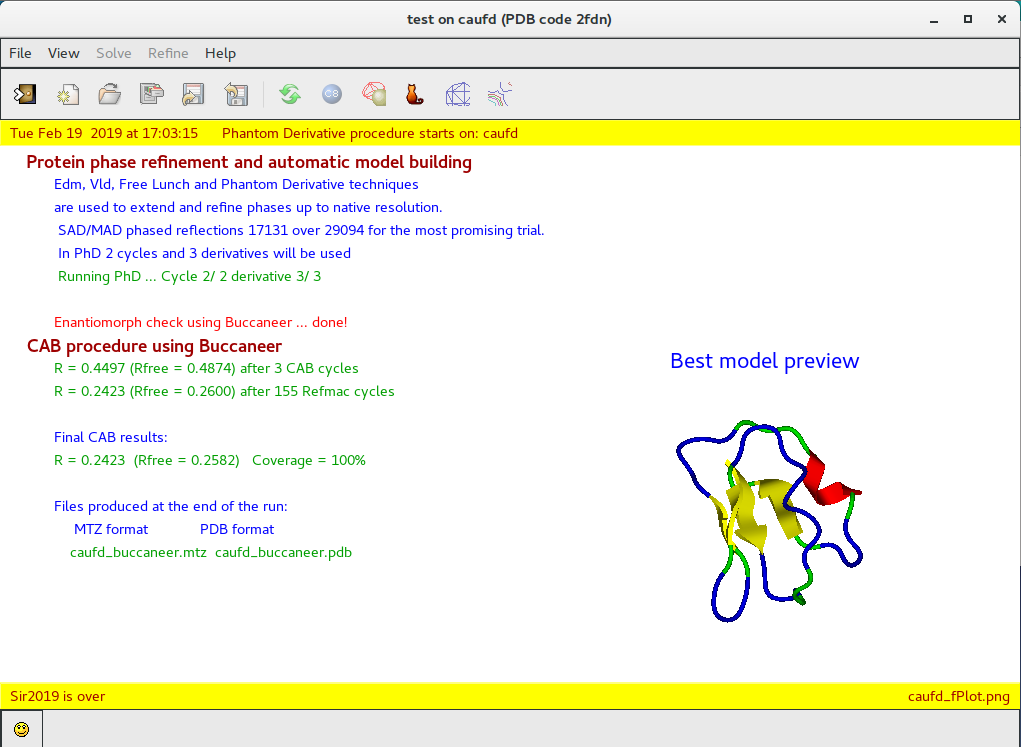
By means of the “Summary” ![]() feature in “File” menu is possible to get a synthetic output and also the graphic windows produced by the program during the run (in HTML format). An example of graphical output follows.
feature in “File” menu is possible to get a synthetic output and also the graphic windows produced by the program during the run (in HTML format). An example of graphical output follows.
First part:
substructure determination
Second part:
anomalous substructure refinement and phase extension
Third part:
protein phase refinement and automatic model building using CAB
The following two directives are part of the %DATA section
ANOMALOUS El n f’1 f”1 [f’2 f”2 …]
El is the chemical symbol of the anomalous scatterer, n is the corresponding number of atoms in the asymmetric unit cell, f’ and f” are the values corresponding to the first wavelength used. Up to four wavelengths are allowed. This directive is used for SAD/MAD data. If more than one anomalous scatterer is used, the ANOMALOUS directive has to be repeated for all of them.
NATIVE
Used when also the native data are supplied in the reflections file.
The following directives are part of the %MAD section
WAVE n1 n2 n3 n4
Which wavelengths will be used for substructure refinement and phase extension. The wavelength number order corresponds to that specified in %Data with the directive ANOMALOUS
For example:
WAVE 1 3 Only the first and the third wavelength will be used.
If the directive WAVE is absent all the wavelengths will be used.
SET n1 n2
Specifies the number (the range) of the substructures previously obtained.
n1, n2 = 1 , 2 … 10 (ordered by FOM_frag)
For example:
SET 1 2 the first two sets (in order of FOMfrag) will be used.
The default is SET 1 – 1, i.e. all fragments will be used.
LSQ nm
Conditions for the refinement (LSQ) of the substructure/wavelength parameters;
n=0,1,..5 specifies the options for substructure parameters (x,y,z, B-factor, sof).
0 no refinement
1 only B-factor
2 x, y,z
3 x, y, z , B-factor
4 only sof
5 x, y, z, B-factor, sof
The default value is 5.
m specifies the options for wavelength parameter (f” , df’).
0 no refinement
1 f”
2 df’
3 f”, df’
The default value is 3.
For example:
LSQ 50 Refine only substructure parameters x,y,z, B-factor, sof
LSQ 53 Refine all parameters: x, y, z, B-factor, sof, f” and df’
POSITIONS string
String is the name of the file (*.pdb) which contains the coordinates of the anomalous substructure.
Default: the program will use the file structurename_SIR200x.fra written during the anomalous scatterer substructure determination.